Digital Building Stock Model (DBSM)
Bridging Geospatial Databases and Artificial Intelligence via the Model Context Protocol (MCP)
Project Overview
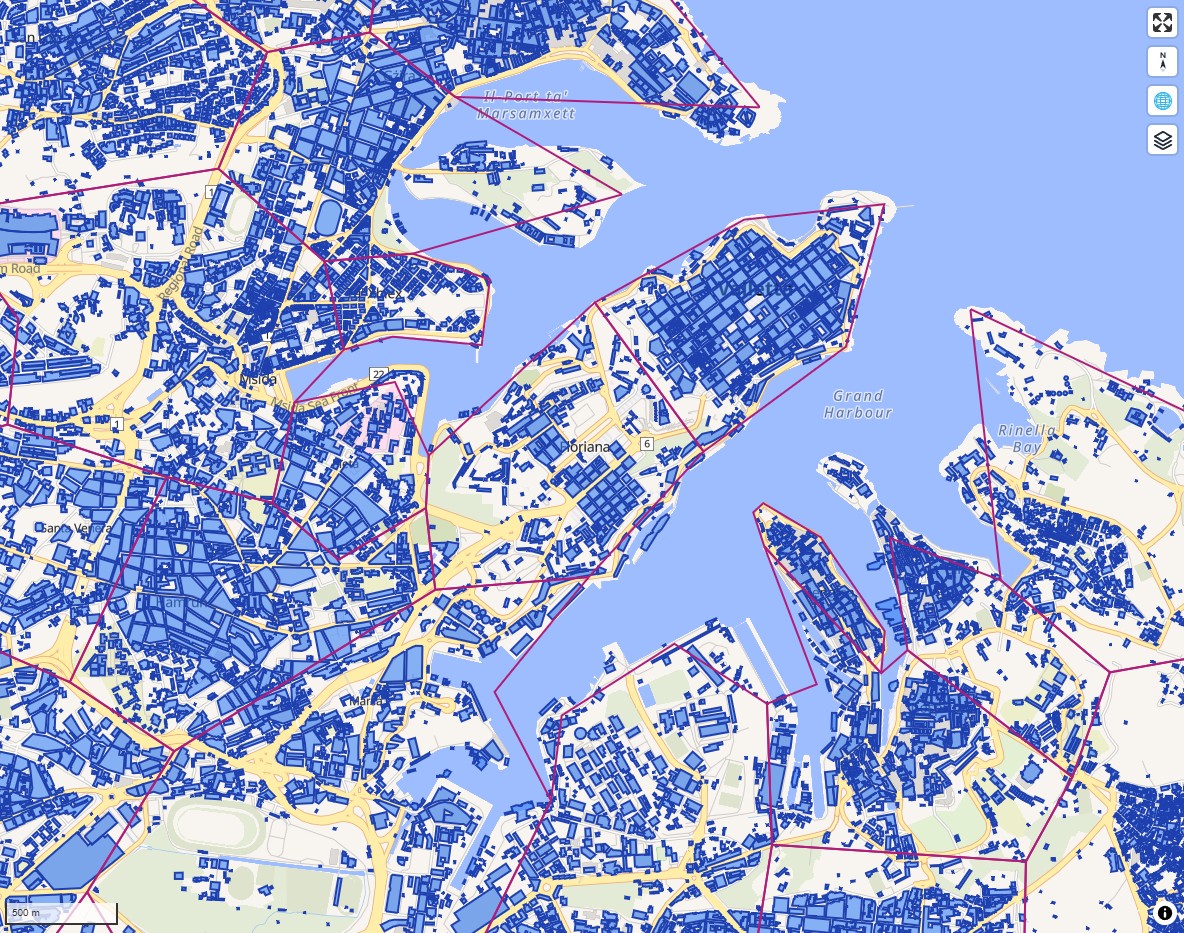
The Digital Building Stock Model (DBSM) stores millions of granular geospatial records—ranging from building footprints and height estimates to total floor area, energy demand, and solar photovoltaic potential across European statistical regions (NUTS1, NUTS2, NUTS3, and LAU level).
While geospatial databases hold immense value for urban decarbonization and climate action, accessing them has historically required specialized GIS skills, spatial SQL knowledge, and custom scripts. By developing a dedicated Model Context Protocol (MCP) server that exposes the DBSM API directly to Large Language Models (LLMs), policy analysts, urban planners, and decision-makers can now ask complex natural-language questions and receive instant, deterministic spatial analytics.
The Friction in Traditional GIS Analytics
Unlocking building stock intelligence is critical for regional climate strategies, rooftop solar installation policies, and energy efficiency targets. However, traditional workflows encounter significant barriers:
The Conversational AI Frontier
Generative AI models are natural interfaces for human interaction, but standard LLMs fail when asked for precise spatial statistics—they tend to hallucinate numbers or lack access to up-to-date database records.
The Solution: Deterministic Tool Calling via MCP
Instead of allowing the LLM to guess, the Model Context Protocol (MCP) provides standard, secure contracts that empower the LLM to query the DBSM API directly. The AI handles natural language interpretation, while PostGIS and the DBSM engine perform exact spatial math.
Architecture: How DBSM & MCP Work Together
1. Geospatial Database
PostGIS / Spatial Engine
Stores millions of building geometries, floor area calculations, age classes, and solar potential mapped to NUTS and LAU boundary polygons.
2. DBSM REST API
High-Performance Endpoints
Exposes high-level aggregation and filtering endpoints (e.g. regional rankings, bounding box queries, statistical comparisons).
3. MCP Server Layer
Model Context Protocol
Defines structured JSON schemas and tool capabilities, allowing LLMs to auto-discover and safely invoke spatial functions.
4. LLM & User Interface
Natural Language Insights
Interprets plain English queries, invokes the appropriate MCP tool, and formats structured responses into clear executive summaries.
Standardized MCP Tools Exposing the DBSM API
The DBSM MCP server exposes a rich suite of geospatial analytics tools. The AI assistant dynamically selects the exact tool based on the user's inquiry:
| MCP Tool Name | Geospatial Capability | Sample Natural Language Prompt |
|---|---|---|
get_country_nuts_stats |
Aggregates building counts, floor area, and solar metrics across NUTS1/2/3 regions. | "What is the total residential floor area and solar potential in NUTS2 regions of Austria?" |
compare_regions |
Performs side-by-side comparative analysis of building stock density and age between regions. | "Compare the building stock volume and solar potential between Tyrol and Styria." |
get_region_ranking |
Ranks administrative areas by custom metrics (e.g. highest rooftop solar capacity). | "Rank all Austrian NUTS3 regions by rooftop solar generation potential." |
search_buildings_bbox |
Retrieves individual building footprints and parameters within a bounding box. | "Find all commercial buildings in central Vienna within a specific bounding box." |
lookup_nuts_by_point |
Resolves geographic point coordinates (latitude/longitude) to specific NUTS/LAU codes. | "Which administrative NUTS region does coordinate (48.2082, 16.3738) fall into?" |
Natural Language to Spatial Intelligence: In Action
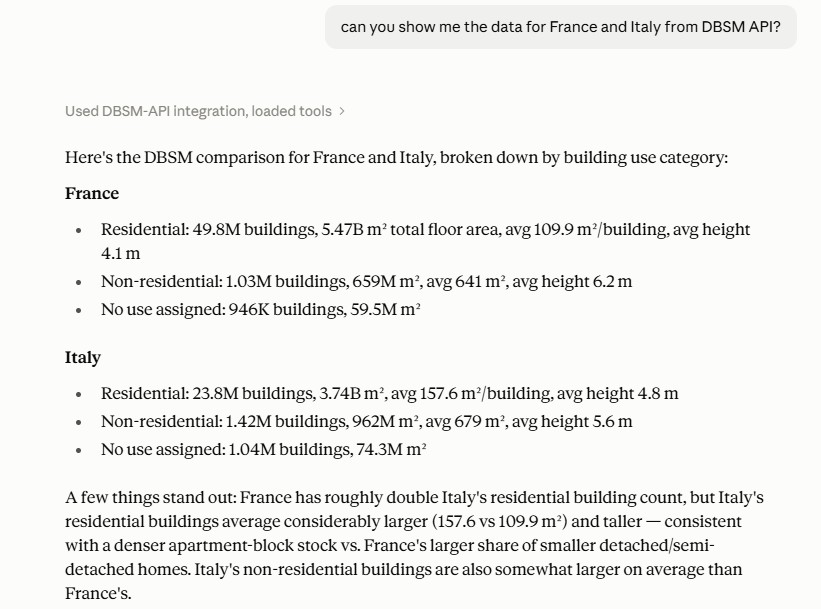
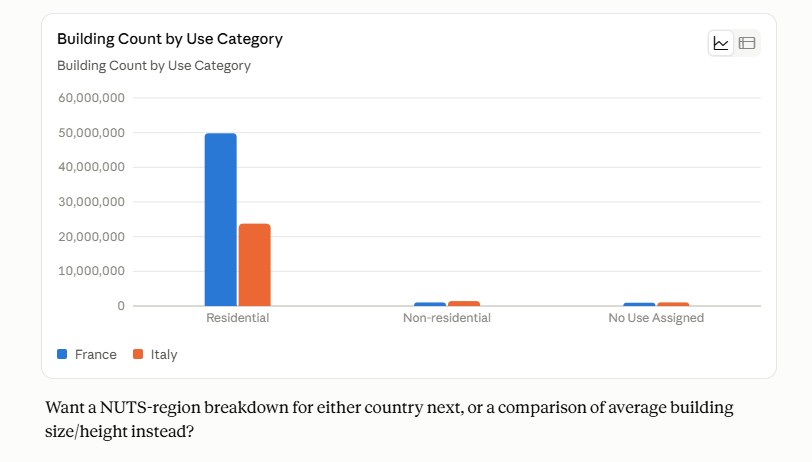
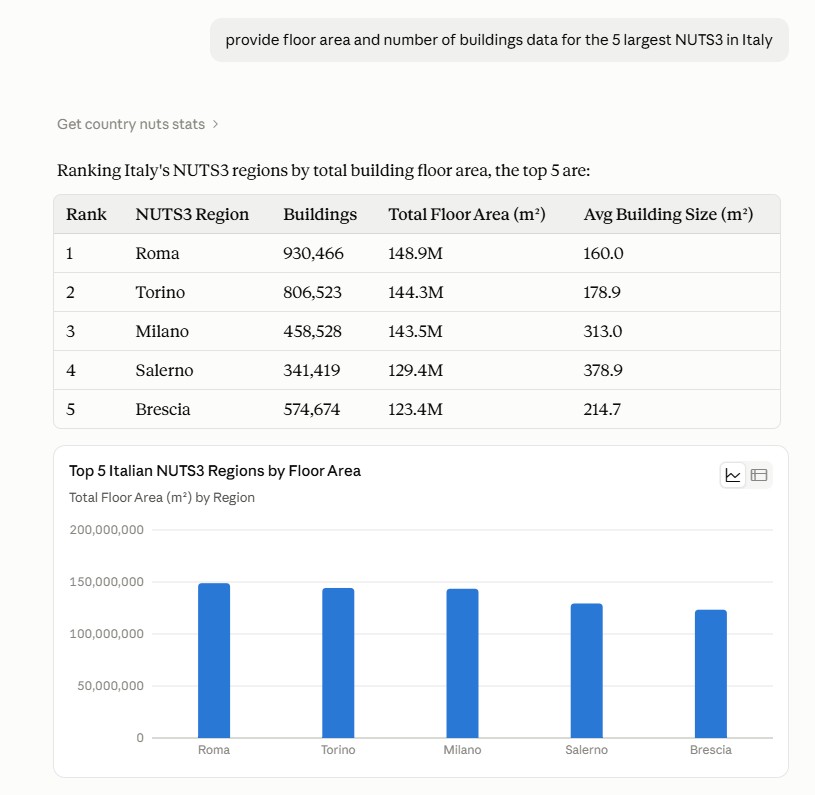
Below is an illustration of how an urban policy analyst interacts with the system:
get_country_nuts_stats(country="AUT", level=2) ⬇️
Here is the regional summary of residential building stock and solar potential across Austrian NUTS2 regions:
| NUTS2 Region | Region Name | Building Count | Total Floor Area (m²) | Est. Rooftop Solar Potential (GWh/yr) |
|---|---|---|---|---|
AT11 |
Burgenland | 132,450 | 24.8 Million | 1,420 |
AT12 |
Niederösterreich | 584,200 | 112.5 Million | 6,150 |
AT13 |
Wien (Vienna) | 178,900 | 94.2 Million | 3,890 |
AT21 |
Kärnten | 210,300 | 38.7 Million | 2,240 |
AT22 |
Steiermark | 415,800 | 76.1 Million | 4,380 |
AT31 |
Oberösterreich | 492,100 | 92.4 Million | 5,110 |
Key Benefits of the MCP Approach
Looking Ahead
Integrating Model Context Protocol with spatial data infrastructures represents a paradigm shift in urban analytics. Beyond static dashboards and specialized GIS workstations, decision-makers can engage in dynamic dialogues with nationwide digital twins—evaluating climate risks, retrofitting needs, and renewable energy transitions in real time.