Building stock analysis
Explore building footprints, floor area and available building attributes across administrative areas. Compare places and identify where more detailed investigation is needed.
SERVICE / URBAN & BUILDING INTELLIGENCE
Spatial analysis of buildings, services and environmental conditions to support urban planning and adaptation.
Explore building footprints, floor area and available building attributes across administrative areas. Compare places and identify where more detailed investigation is needed.
Assess access to services through walking, cycling and transport networks. Map gaps in provision and compare potential locations.
Combine satellite-derived land surface temperature with land cover and population information to investigate heat exposure and vulnerability.
Translate analysis into maps, regional comparisons, analytical reports and data workflows. The scope and outputs are defined around your planning question.
PRACTICAL EXAMPLES / GEOAI
Three analyses of a sample area in Rome, between Testaccio and Ostiense, generated from the GeoAI platform’s local code and datasets. These exploratory examples help identify where further investigation is useful.
GeoAI is a platform under development and conceptual refinement, designed to bring building data, urban services, Earth observation and meteorological information together in a single analytical environment. The work focuses on defining the methodology, capabilities and ways to make the results useful for planning and spatial decision-making. These examples show how the methodology connects a planning question to readable spatial results. The analyses are precomputed: this page requires no Ollama service and runs no new calculations.
Explore the code on GitHub ↗Buildings: local EUBUCCO dataset. Services: local Rome point-of-interest dataset. Land cover: ESA WorldCover 2021. Sample area: 12.468–12.491° E; 41.869–41.885° N. These exploratory estimates require verification with current data and site-specific investigation.
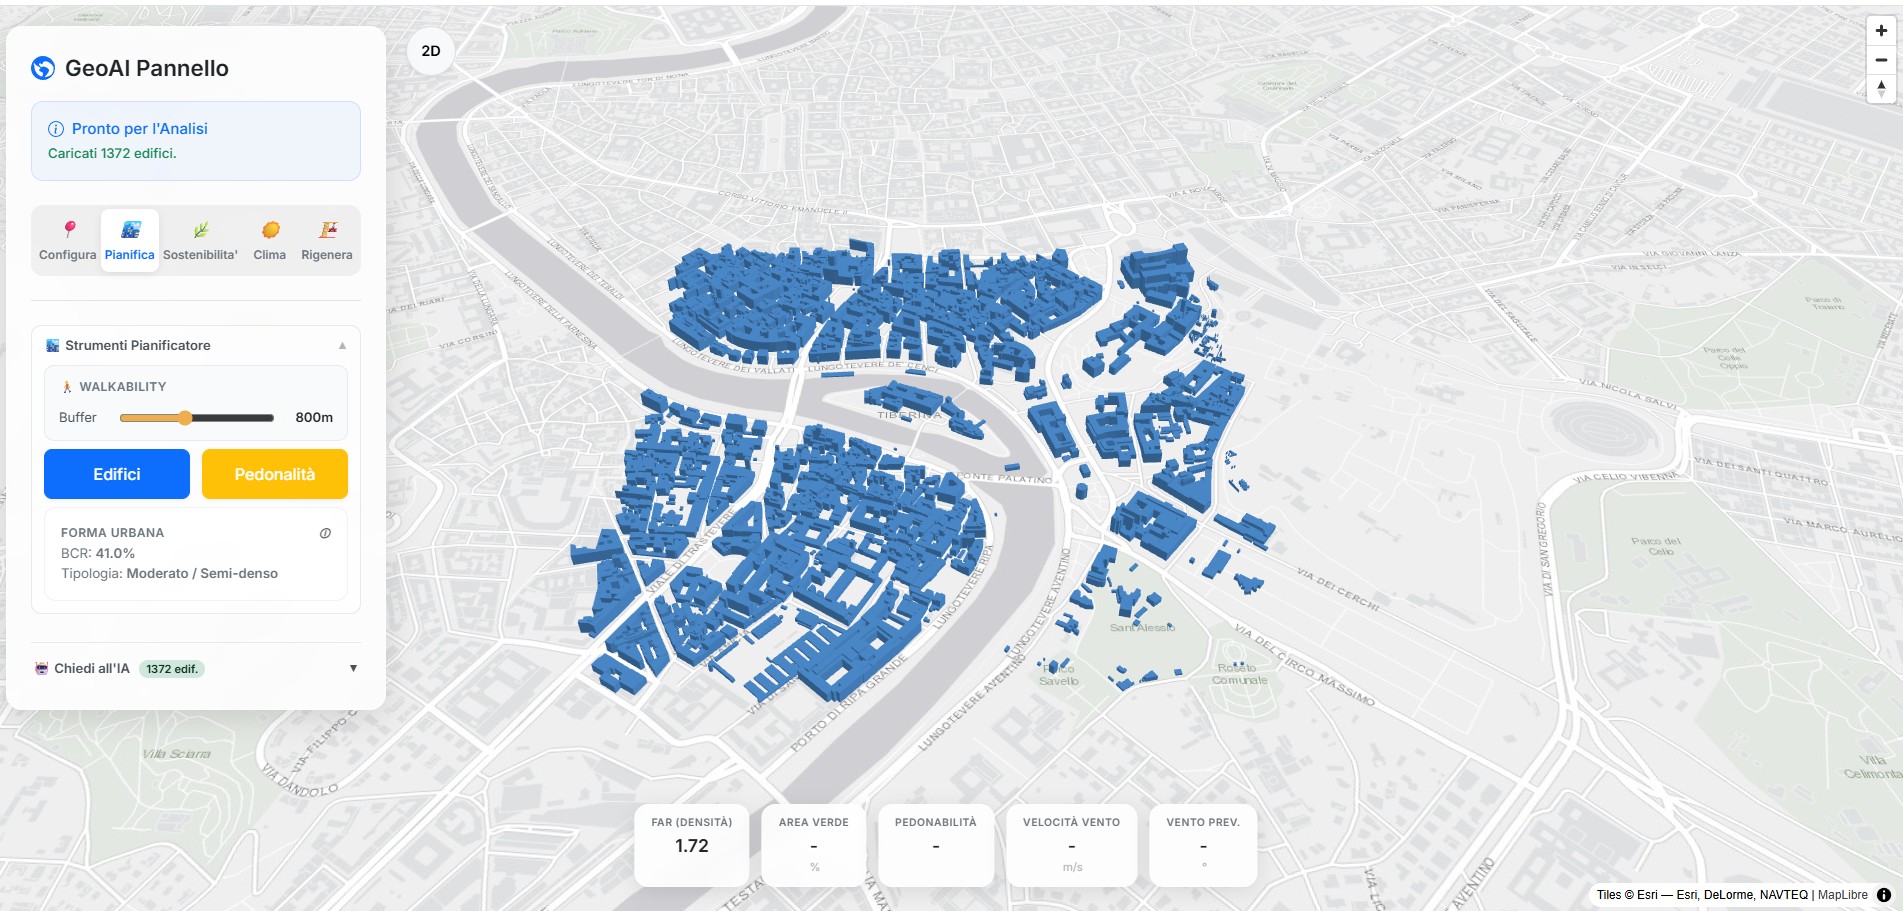
From spatial data to an integrated understanding of the city.
The platform brings data and analytical methods together; professional interpretation connects the results to spatial decisions. The AI assistant connects indicators with supporting documentation, as described below. The examples below are precomputed analyses.
GeoAI integrates a language model (LLM) connected to an Ollama service on the local network. The assistant receives the question, a summary of analyses already performed in the study area and relevant excerpts from indexed documents. It helps interpret results; it does not run new spatial analyses.
What do you want to understand about the study area?
Buildings and previously calculated indicators provide context.
The RAG system searches for passages related to the meaning of your question.
The model combines data and retrieved text, with document and page references.
RAG stands for retrieval-augmented generation: the system searches the document archive before generating an answer. PDFs in data/regulations are prepared through an indexing process that splits text into passages and retains the document name and page. Up to four passages are retrieved for each question and supplied to the model. Adding a PDF to the folder requires updating the index before it becomes searchable.
The current archive includes documents concerning Italy’s consolidated building law, Salva Casa legislation, circulars and interpretative guidance, alongside Rome’s building regulations. The system consults indexed copies: it does not automatically verify their currency or guarantee the relevance of every retrieved passage. Answers and references should be checked against the original documents.
Examples of questions for exploring the indexed PDFs. Answers depend on the texts actually included in the index and the passages retrieved.
You can add: “Identify the document and page supporting your answer, and flag missing information.” The system helps explore the archive; it does not certify a property’s compliance or automatically verify current legislation.
Analysis screenshots from different areas of Rome. Select an image to enlarge it within the page; the displayed indicators relate to individual demonstration sessions. The interface shown is in Italian.
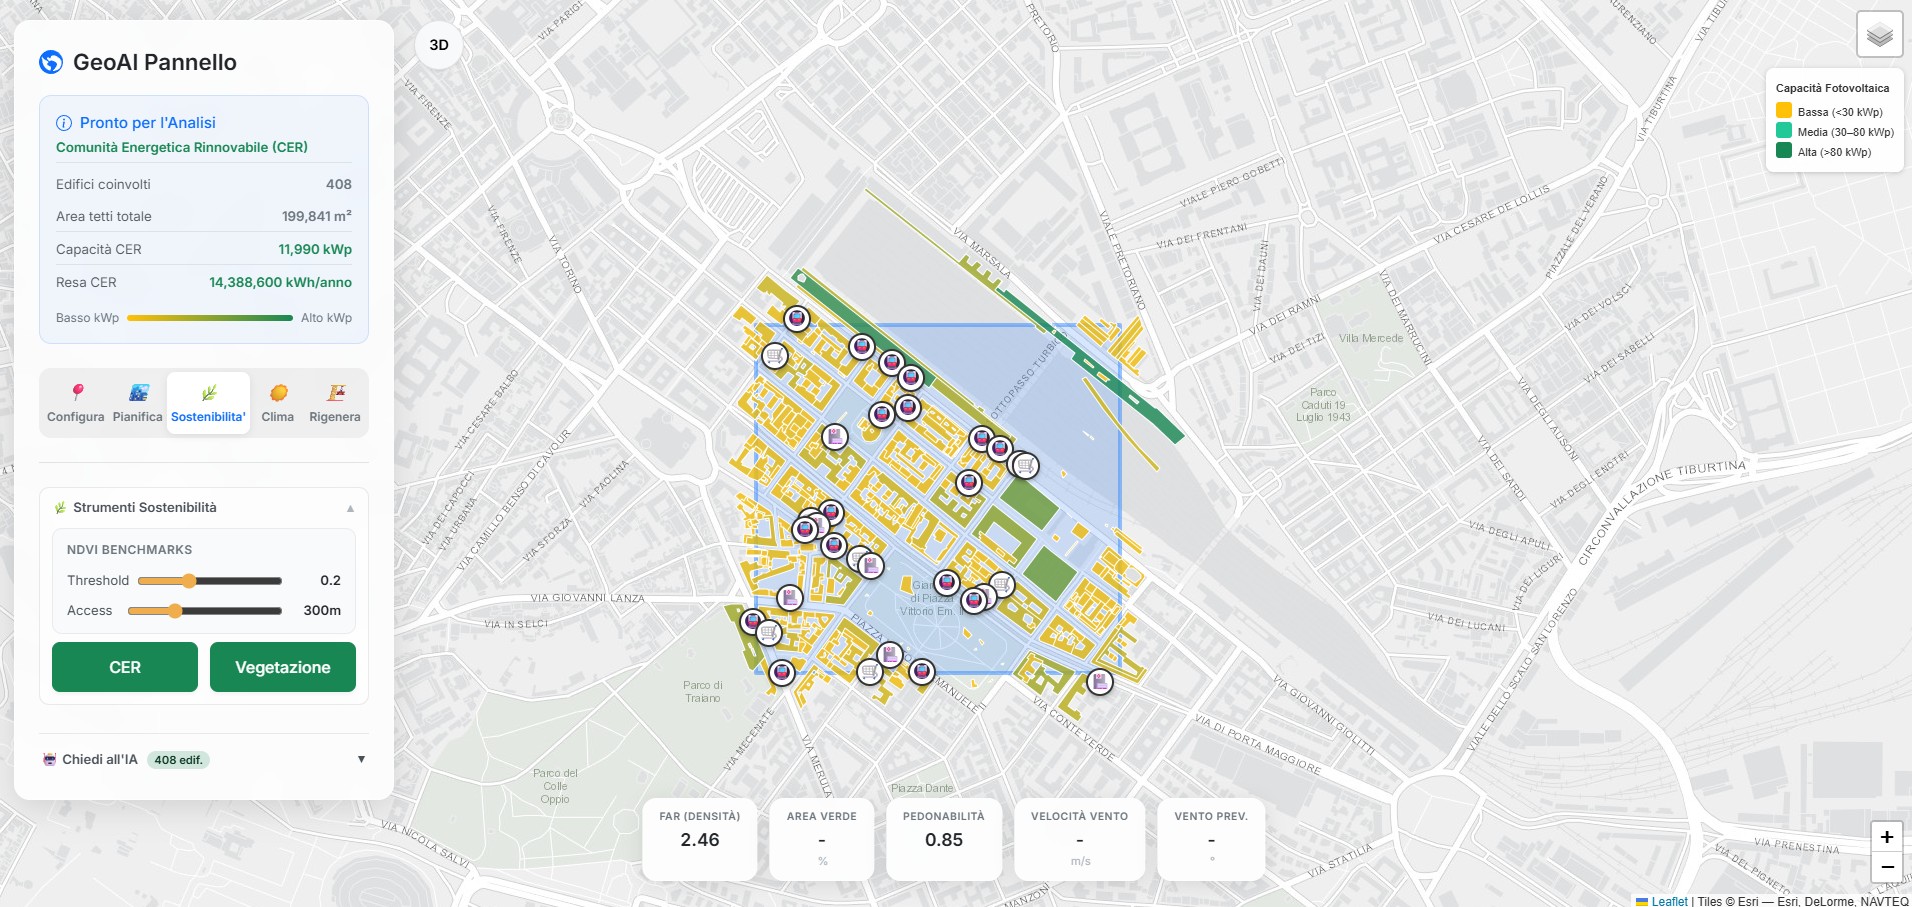
An initial estimate of roof areas and photovoltaic capacity within the selected area.
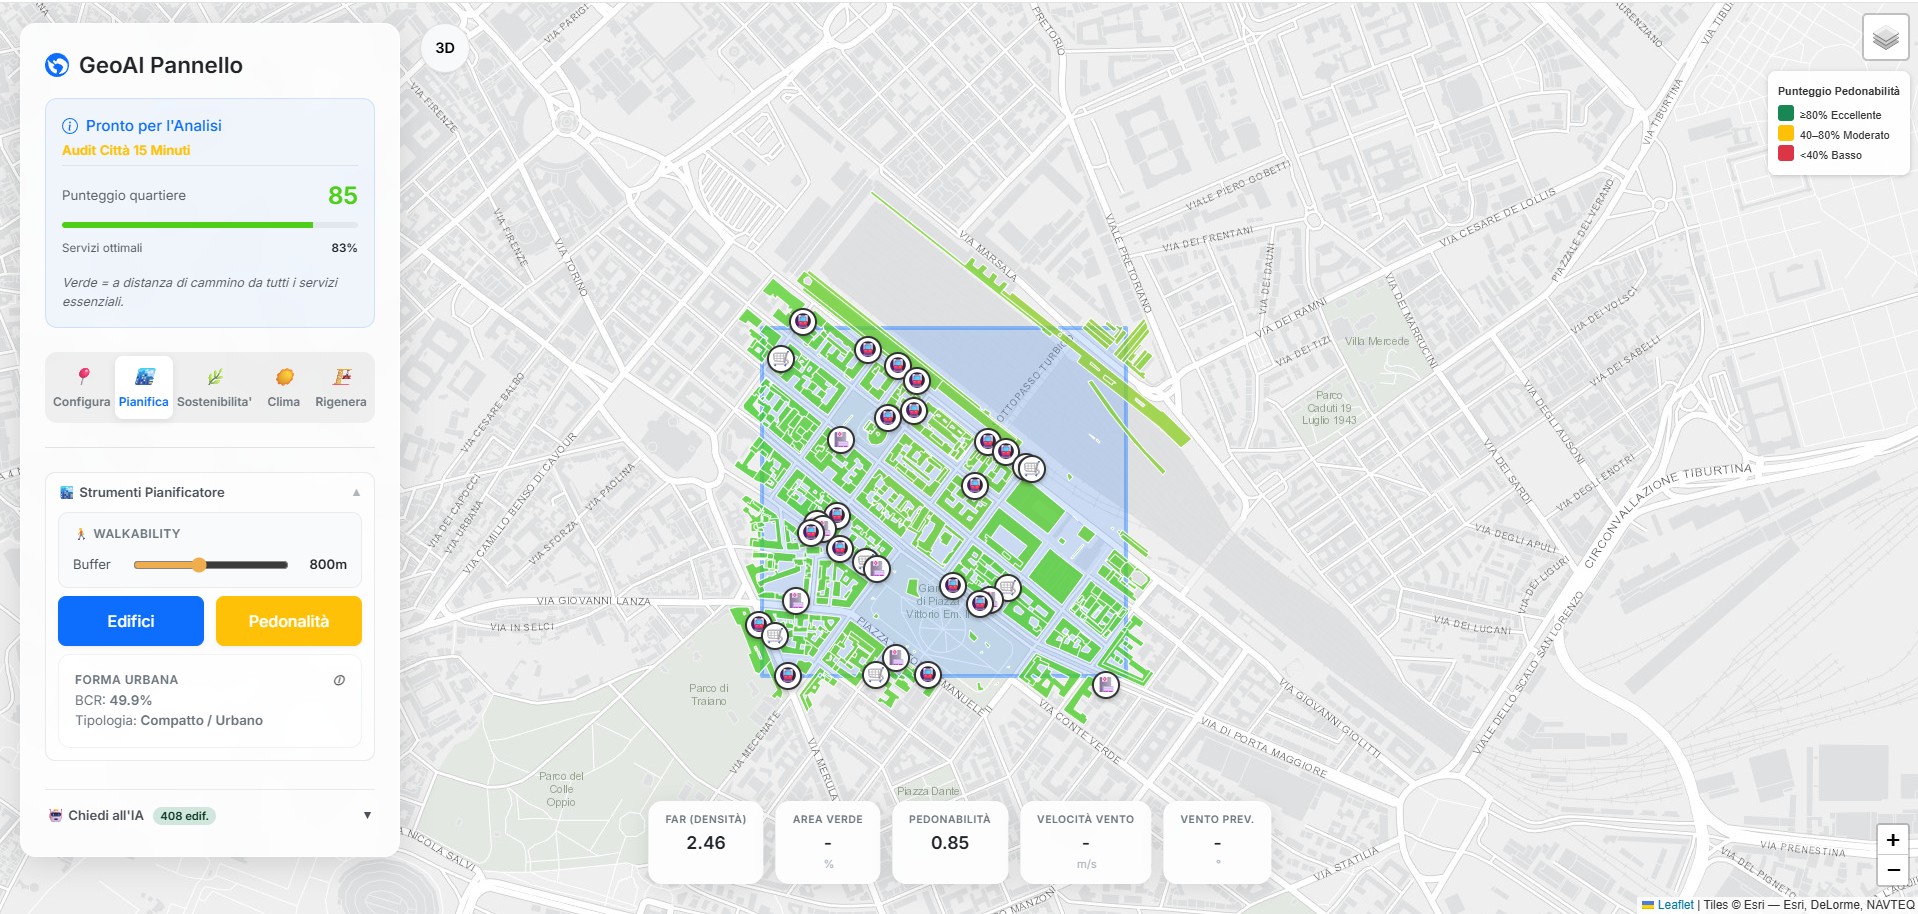
Buildings and points of interest viewed together to compare service provision. The index uses straight-line distances.
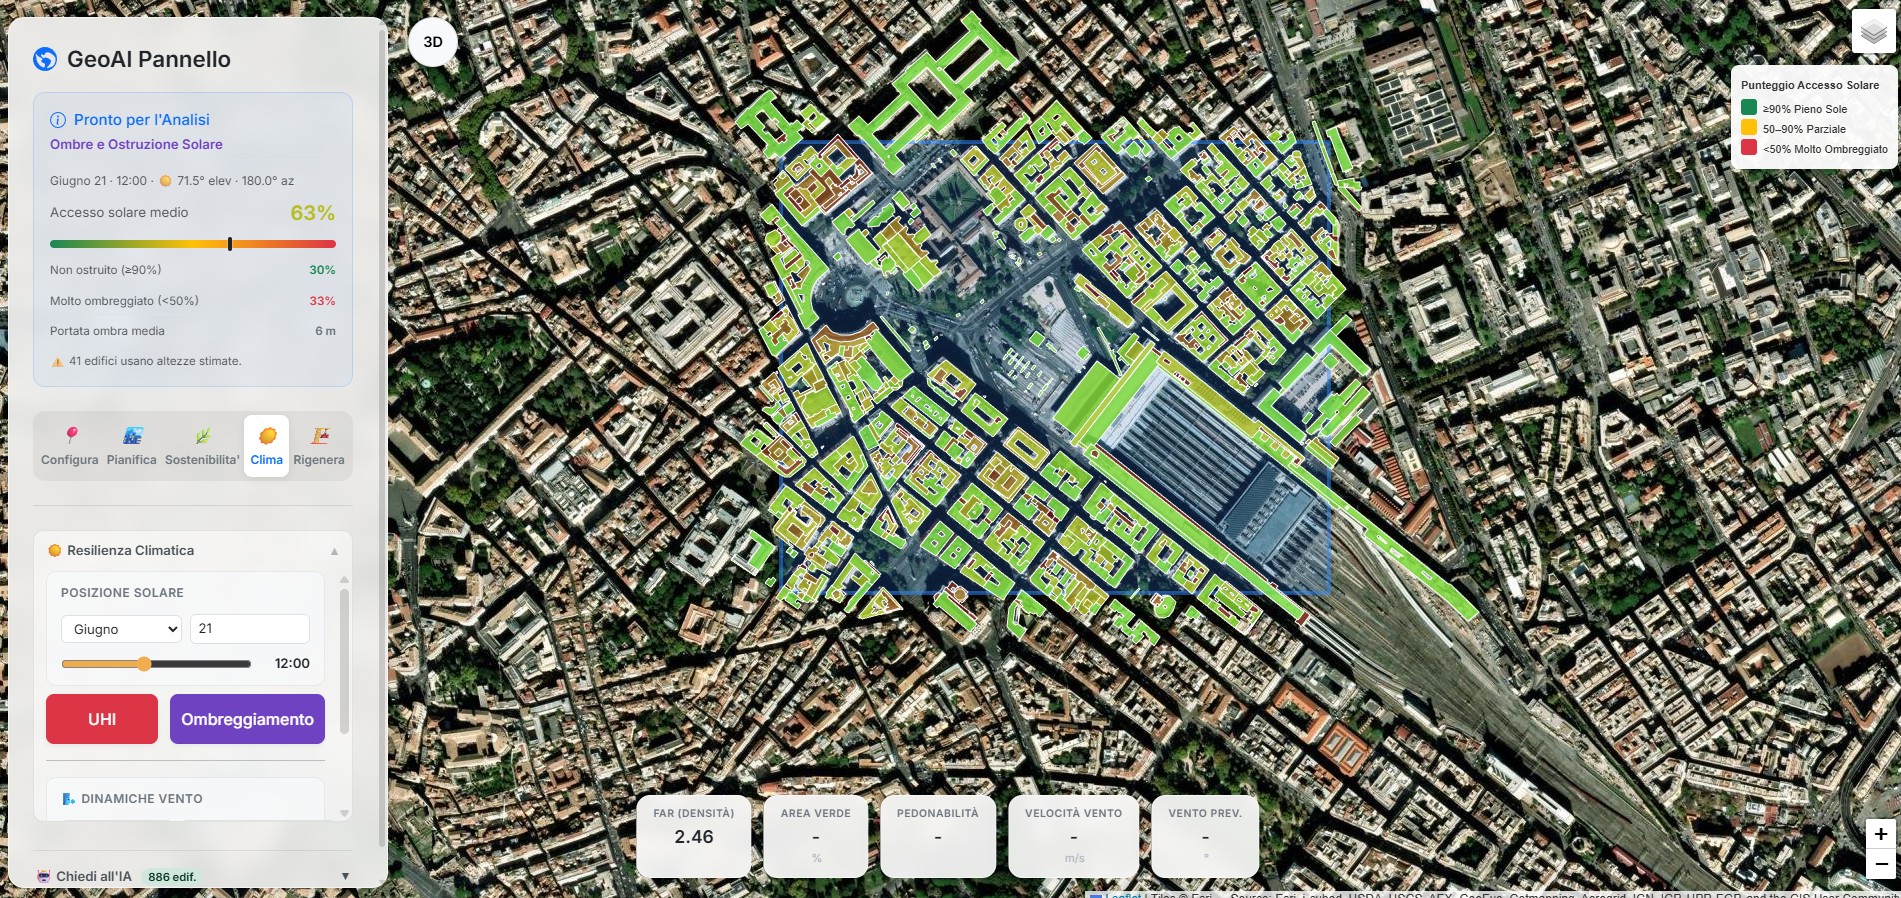
Exploration of shading for a selected date and time, including an indication of estimated building heights.
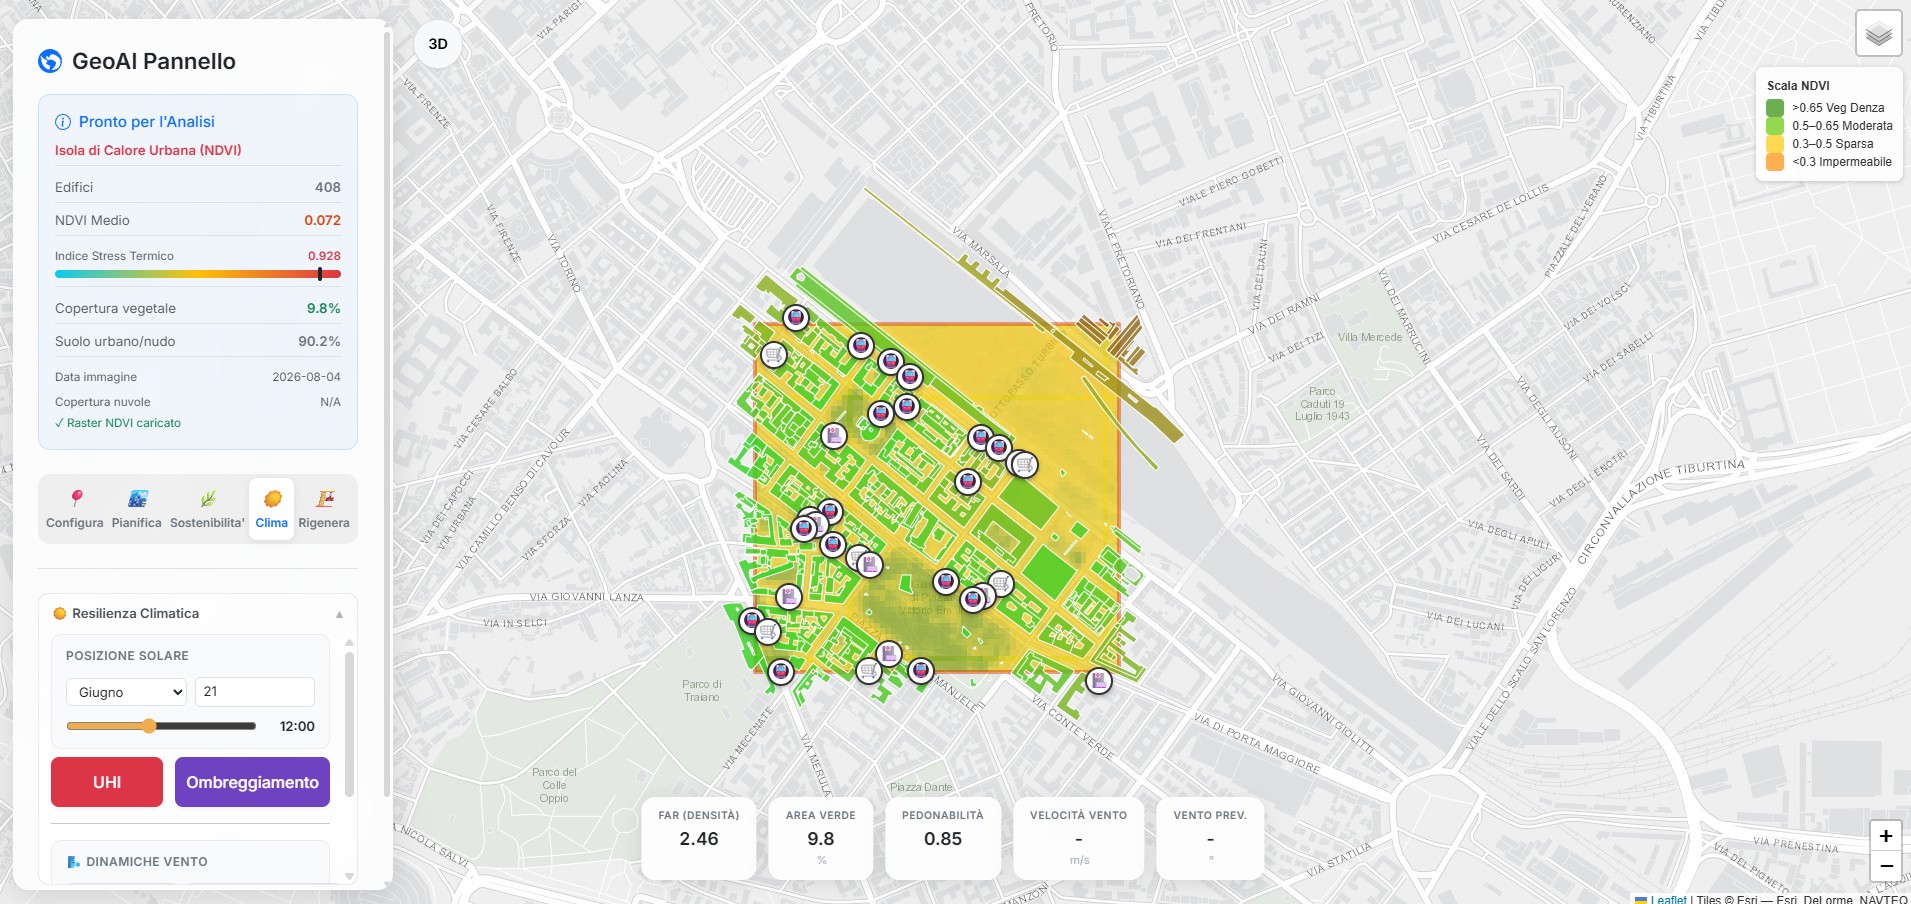
NDVI helps describe vegetation presence. Derived indicators are not direct temperature measurements.
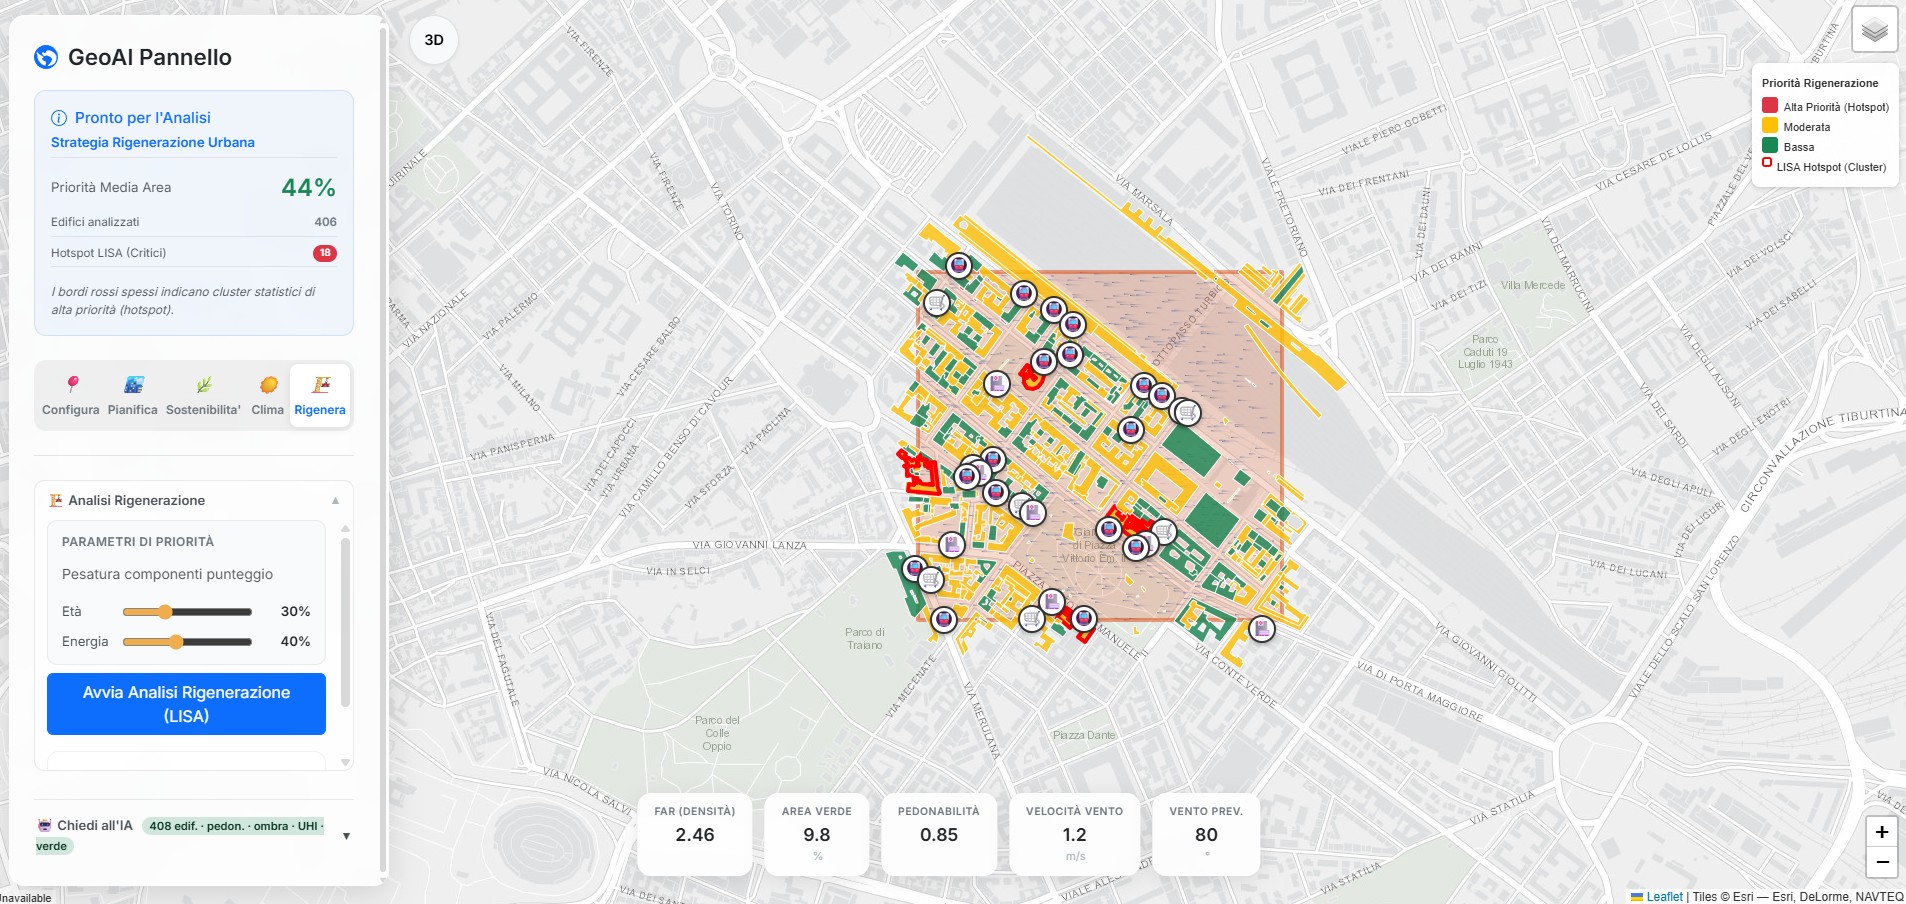
An example of comparing indicators and identifying spatial concentrations for further investigation.
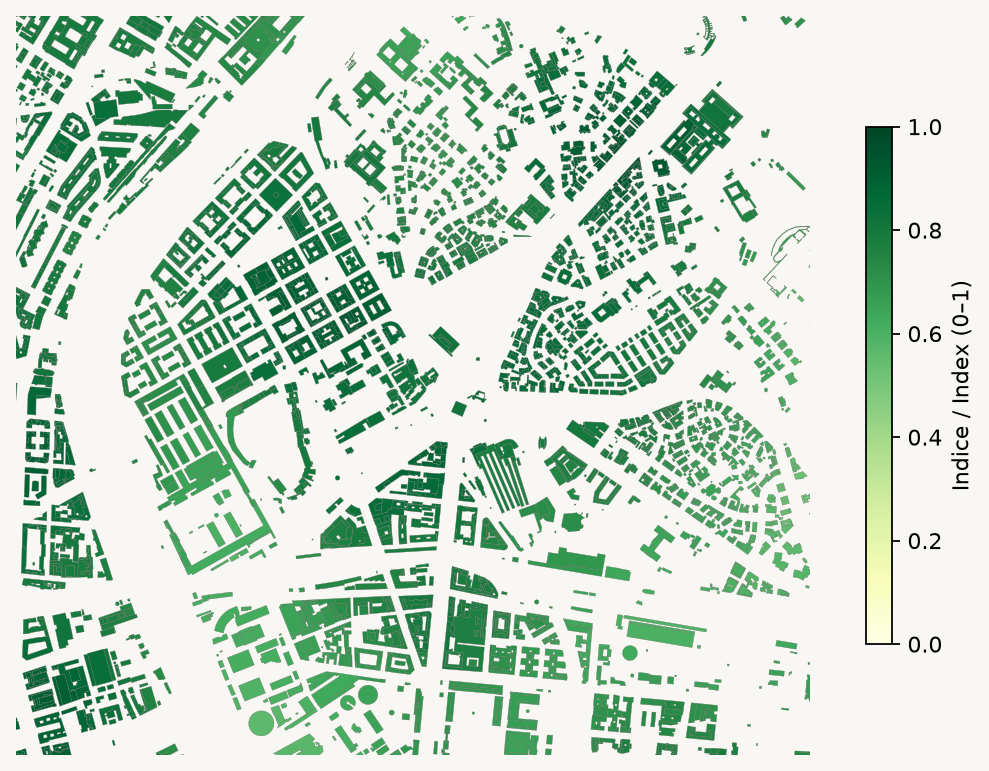
Buildings are compared by proximity to grocery shops, schools, healthcare and transport. Darker green indicates a higher proximity index.
Decision support: To identify areas for further investigation and compare the distribution of services.
Mean index across four categories, using straight-line distances and a 1 km threshold. It does not represent walking times or network routes and depends on POI completeness.
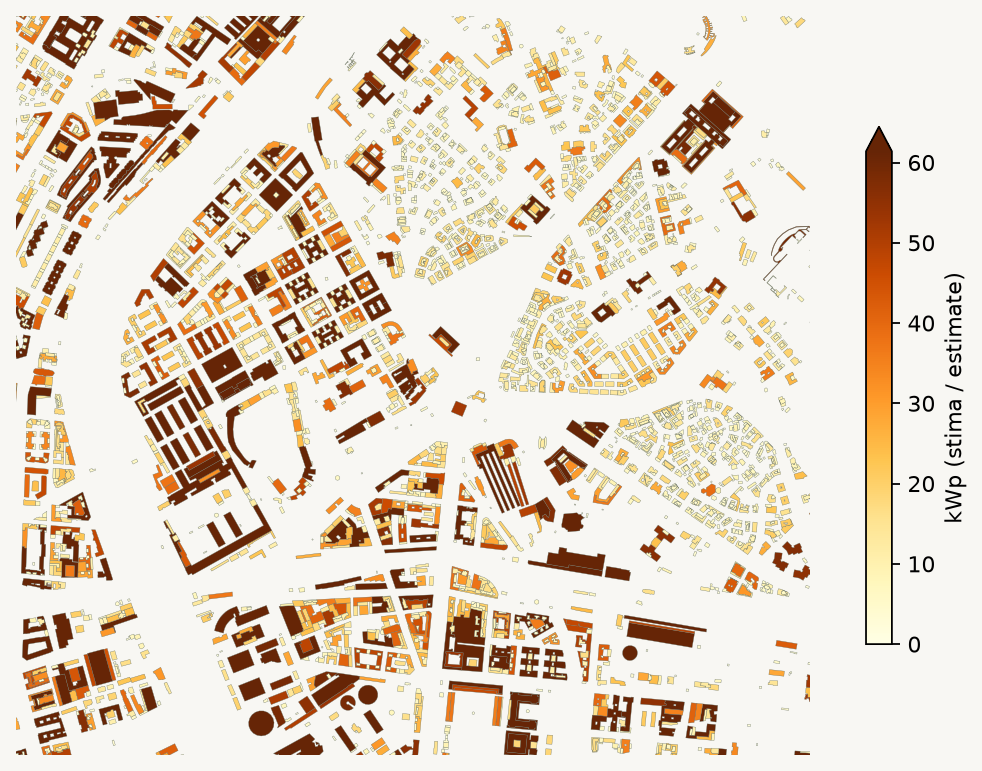
Building footprints are coloured by a preliminary estimate of installable photovoltaic capacity. Darker shades indicate higher values.
Decision support: To shortlist buildings or groups of buildings for more detailed technical assessment.
Footprint-based estimate: 60% available area and 10 m² per kWp. It excludes structural suitability, roof shape, constraints and shading. The colour scale is capped at the 95th percentile.
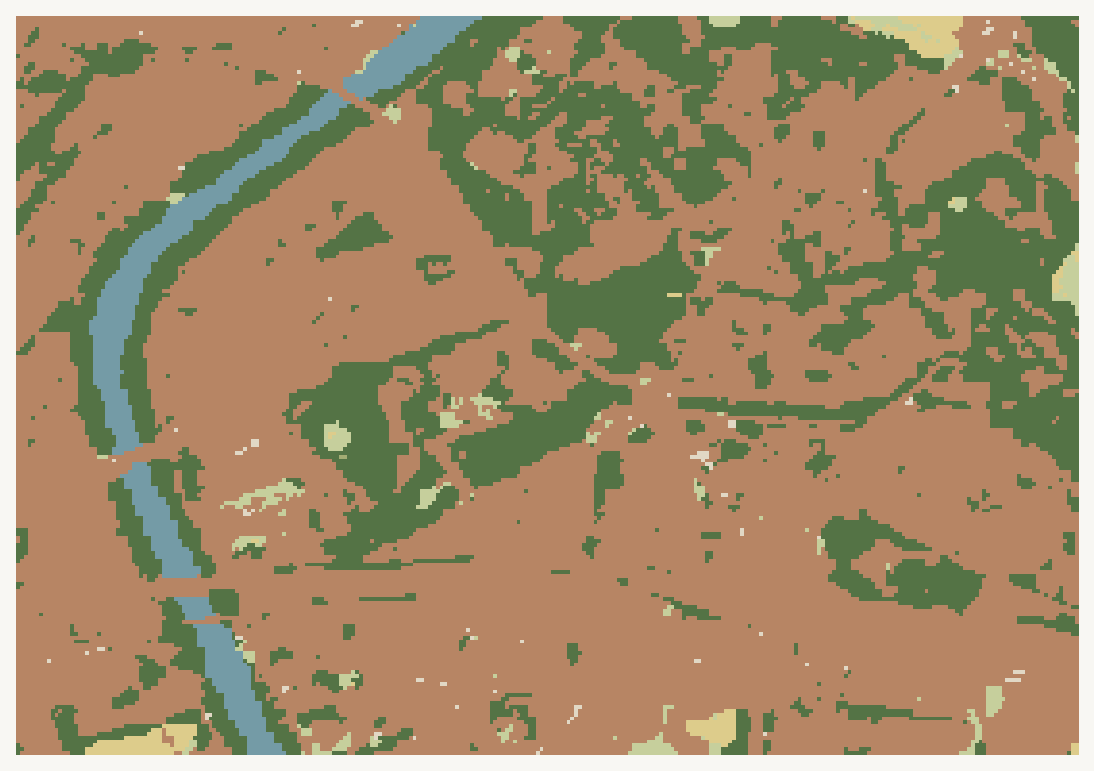
Land cover distinguishes built-up areas in brown, vegetation in green and water in blue.
Decision support: To understand the environmental context and frame further investigations into vegetation and permeability.
ESA WorldCover 2021, nominal resolution 10 m. This is a land-cover classification; it does not directly measure temperature, flood risk or green-space accessibility.
RELATED WORK
Share your geographic scope, available data and the decision you want to support.
Discuss your project ↗