Digital Building Stock Model | Fabio Lana Skip to content
← All projects

BUILDINGS / RENOVATION / TERRITORIAL INTELLIGENCE

From building data
to human questions.

Conceiving an API and a natural-language system that make existing building-stock data accessible for planning and resilience decisions.
Project
Digital Building Stock Model
Context
European building stock
Period
2024–2025 · JRC assignment
My contribution
API conception & natural-language system design
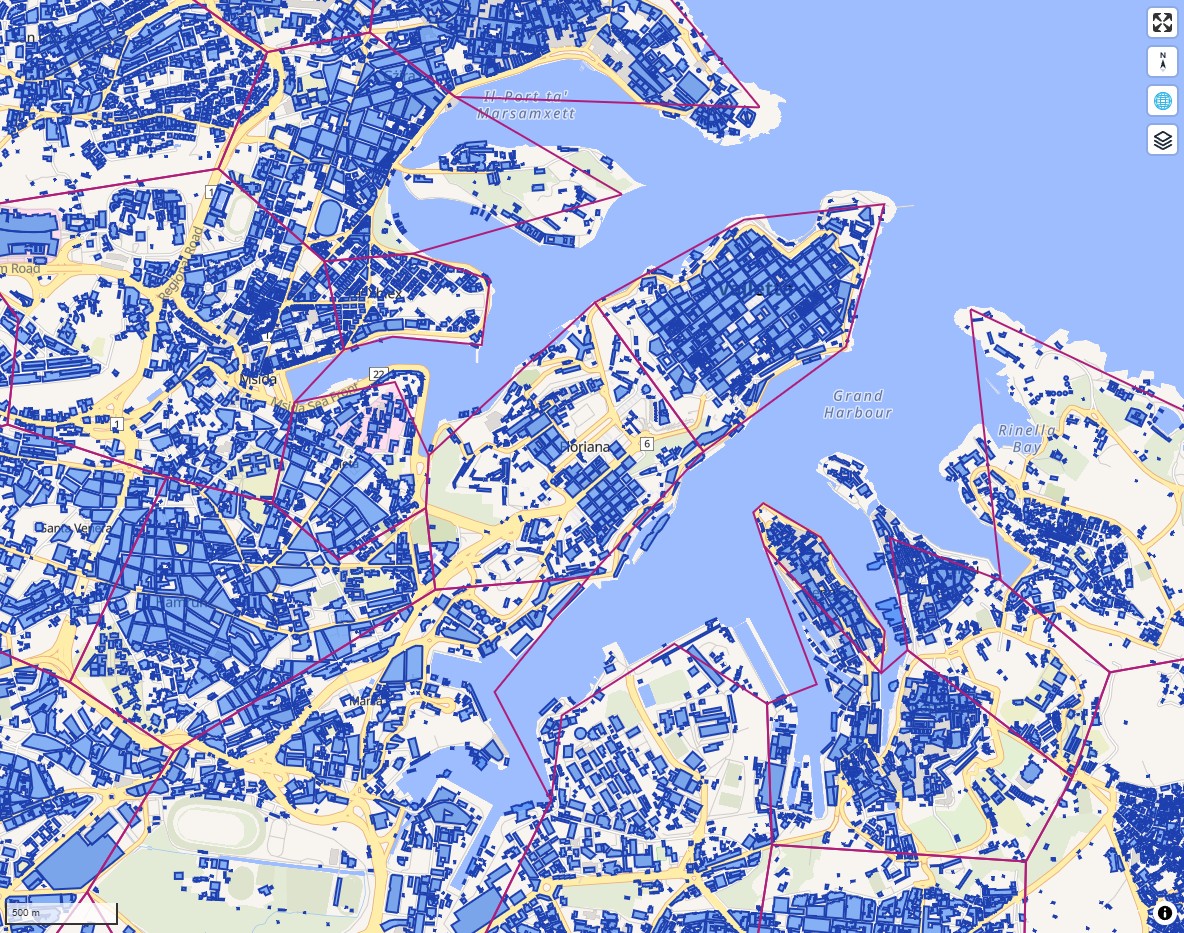
Building footprints and local administrative boundaries in the DBSM interface.

THE QUESTION

Digital Building Stock Model

An existing building-stock dataset can support renovation and resilience planning, but accessing it through specialist queries creates a barrier. How could that information become a system people can explore by asking questions in their own words?

MY CONTRIBUTION

Turning an existing dataset into a system people can question.

The building-stock dataset already existed. I conceived the API that would make it accessible and, most importantly, the transformation of that API into a system people could interact with in natural language through the Model Context Protocol (MCP).

Working largely independently, I shaped the overall system concept: connecting human questions to structured access to building information, so that the data could support analysis and decisions beyond specialist database workflows.

THE APPROACH

Human questions. Structured spatial answers.

The API provides access to the existing building-stock data. MCP connects that access to a conversational interface, allowing a person to ask questions in ordinary language while the underlying queries retrieve the relevant information.

The central design challenge was to connect the way people formulate planning questions with the way spatial data are organised and analysed.

ANALYTICAL OUTPUTS

API concept

Structured access to the existing building-stock dataset and its analytical capabilities.

Natural-language system

An MCP-based connection between human questions and building-stock analysis.

Planning support

Visualisation and reporting designed to support renovation and resilience decisions.

PRACTICAL USE

Supporting informed decisions.

Support investigation of building-stock characteristics and regional differences relevant to the EU Renovation Wave and Recovery and Resilience Plans. Comparisons must account for dataset coverage, validation and model assumptions.

RELATED WORK

Have a similar question?

Discuss your data, geographic scope and the decision you need to support.

Discuss your project ↗
Technical documentation & project archive

Historical project material and examples. Figures and external data should be assessed in their original context.

Digital Building Stock Model (DBSM)

Bridging Geospatial Databases and Artificial Intelligence via the Model Context Protocol (MCP)

PostGIS / Spatial DB DBSM REST API Model Context Protocol (MCP) LLMs & Conversational AI Urban Analytics & Decarbonization

Project Overview

The Digital Building Stock Model (DBSM) stores millions of granular geospatial records—ranging from building footprints and height estimates to total floor area, energy demand, and solar photovoltaic potential across European statistical regions (NUTS1, NUTS2, NUTS3, and LAU level).

While geospatial databases hold immense value for urban decarbonization and climate action, accessing them has historically required specialized GIS skills, spatial SQL knowledge, and custom scripts. By developing a dedicated Model Context Protocol (MCP) server that exposes the DBSM API directly to Large Language Models (LLMs), policy analysts, urban planners, and decision-makers can now ask complex natural-language questions and receive instant, deterministic spatial analytics.

Geospatial Granularity: Building Footprints & LAU Administrative Boundaries
Digital Building Stock Model - Building Footprints & LAU Boundaries

Figure 1: Digital Building Stock Model (DBSM) visualization showcasing individual building footprint geometries (blue polygons) aggregated across Local Administrative Unit (LAU) boundary boundaries. Using the MCP server, AI models can directly query spatial endpoints like get_lau_buildings and search_buildings_bbox to extract granular building statistics without requiring manual GIS software.

The Friction in Traditional GIS Analytics

Unlocking building stock intelligence is critical for regional climate strategies, rooftop solar installation policies, and energy efficiency targets. However, traditional workflows encounter significant barriers:

  • Data Fragmentation: Spatial boundaries (NUTS/LAU regions) must be joined across massive building polygon datasets.
  • Skill Barrier: Key decision-makers often lack GIS software proficiency (QGIS/ArcGIS) or spatial SQL expertise.
  • Query Latency: Generating custom aggregations across millions of buildings requires dedicated data engineering cycles.

The Conversational AI Frontier

Generative AI models are natural interfaces for human interaction, but standard LLMs fail when asked for precise spatial statistics—they tend to hallucinate numbers or lack access to up-to-date database records.

The Solution: Deterministic Tool Calling via MCP

Instead of allowing the LLM to guess, the Model Context Protocol (MCP) provides standard, secure contracts that empower the LLM to query the DBSM API directly. The AI handles natural language interpretation, while PostGIS and the DBSM engine perform exact spatial math.


Architecture: How DBSM & MCP Work Together

1. Geospatial Database

PostGIS / Spatial Engine

Stores millions of building geometries, floor area calculations, age classes, and solar potential mapped to NUTS and LAU boundary polygons.

2. DBSM REST API

High-Performance Endpoints

Exposes high-level aggregation and filtering endpoints (e.g. regional rankings, bounding box queries, statistical comparisons).

3. MCP Server Layer

Model Context Protocol

Defines structured JSON schemas and tool capabilities, allowing LLMs to auto-discover and safely invoke spatial functions.

4. LLM & User Interface

Natural Language Insights

Interprets plain English queries, invokes the appropriate MCP tool, and formats structured responses into clear executive summaries.


Standardized MCP Tools Exposing the DBSM API

The DBSM MCP server exposes a rich suite of geospatial analytics tools. The AI assistant dynamically selects the exact tool based on the user's inquiry:

MCP Tool Name Geospatial Capability Sample Natural Language Prompt
get_country_nuts_stats Aggregates building counts, floor area, and solar metrics across NUTS1/2/3 regions. "What is the total residential floor area and solar potential in NUTS2 regions of Austria?"
compare_regions Performs side-by-side comparative analysis of building stock density and age between regions. "Compare the building stock volume and solar potential between Tyrol and Styria."
get_region_ranking Ranks administrative areas by custom metrics (e.g. highest rooftop solar capacity). "Rank all Austrian NUTS3 regions by rooftop solar generation potential."
search_buildings_bbox Retrieves individual building footprints and parameters within a bounding box. "Find all commercial buildings in central Vienna within a specific bounding box."
lookup_nuts_by_point Resolves geographic point coordinates (latitude/longitude) to specific NUTS/LAU codes. "Which administrative NUTS region does coordinate (48.2082, 16.3738) fall into?"

Natural Language to Spatial Intelligence: In Action

The example below illustrates the interaction format. Its figures are illustrative, not a verified statistical release or an investment recommendation.

Policy Analyst Natural Language Query
"Can you break down the total floor area and estimated rooftop solar potential across all NUTS2 regions in Austria?"
⬇️ LLM detects intent ➔ Invokes MCP tool get_country_nuts_stats(country="AUT", level=2) ⬇️
Illustrative response format (example figures)

Here is the regional summary of residential building stock and solar potential across Austrian NUTS2 regions:

NUTS2 Region Region Name Building Count Total Floor Area (m²) Est. Rooftop Solar Potential (GWh/yr)
AT11 Burgenland 132,450 24.8 Million 1,420
AT12 Niederösterreich 584,200 112.5 Million 6,150
AT13 Wien (Vienna) 178,900 94.2 Million 3,890
AT21 Kärnten 210,300 38.7 Million 2,240
AT22 Steiermark 415,800 76.1 Million 4,380
AT31 Oberösterreich 492,100 92.4 Million 5,110
Interpretation: A validated regional comparison can help identify areas for further investigation. Confirm dataset coverage, assumptions and source dates before using results in policy or investment decisions.
Live Execution Showcase: Claude (Sonnet) + DBSM MCP Server

The real-world screenshots below illustrate live interactions with Claude (Sonnet) connected directly to the DBSM MCP server. By interpreting plain natural-language prompts, Claude automatically invokes the appropriate DBSM API tools, computes cross-border spatial statistics, generates custom data visualizations, and suggests relevant follow-up investigations.

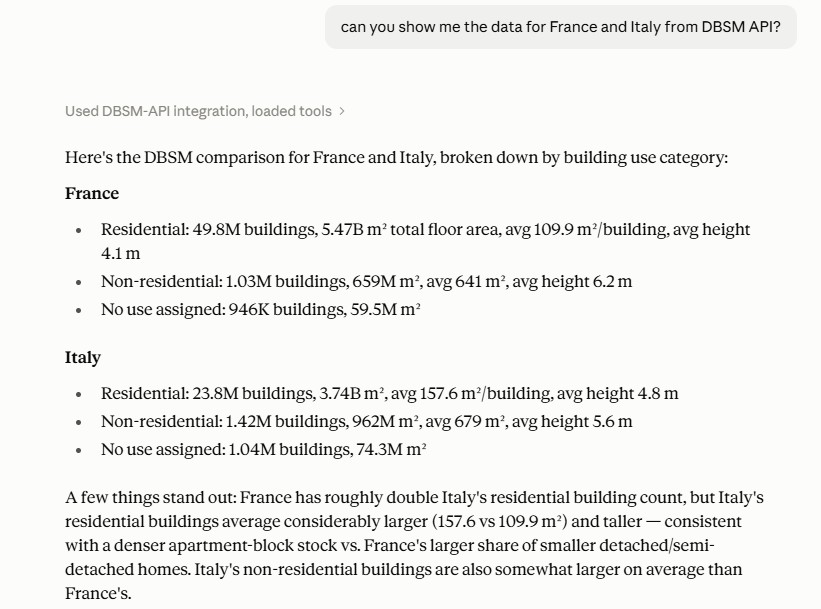
Claude Sonnet using DBSM API MCP to compare France and Italy building stock

1. Multi-Country Spatial Analytics

User Query: "can you show me the data for France and Italy from DBSM API?"
Claude automatically loads the DBSM-API integration, queries national building metrics (49.8M buildings in France vs. 23.8M in Italy), and delivers high-level spatial insights—observing that Italian residential buildings are on average larger (157.6 m² vs 109.9 m²) and taller (4.8 m vs 4.1 m) due to denser apartment-block urban forms.

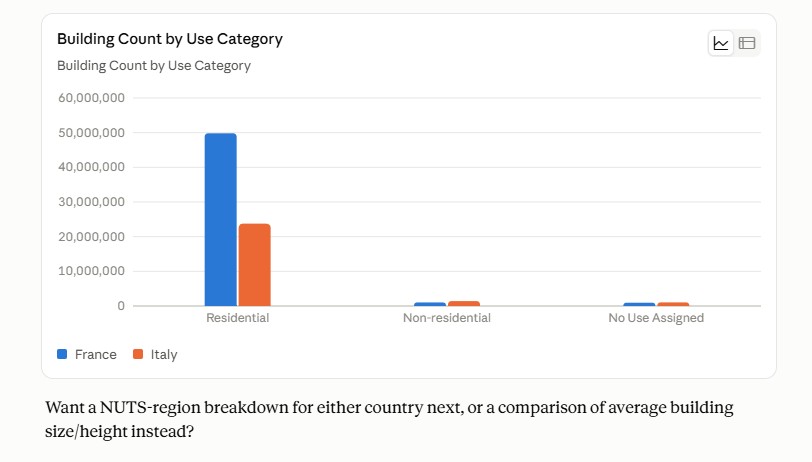
Claude rendering bar chart of DBSM API building count data

2. Dynamic Visualizations & Follow-up

Automated Charting & Reasoning: Beyond returning text metrics, Claude converts the spatial payload from the DBSM API into a visual bar chart comparing Building Count by Use Category (Residential, Non-residential, Unassigned) and prompts the user with next logical analytical queries (e.g. NUTS-region breakdowns).

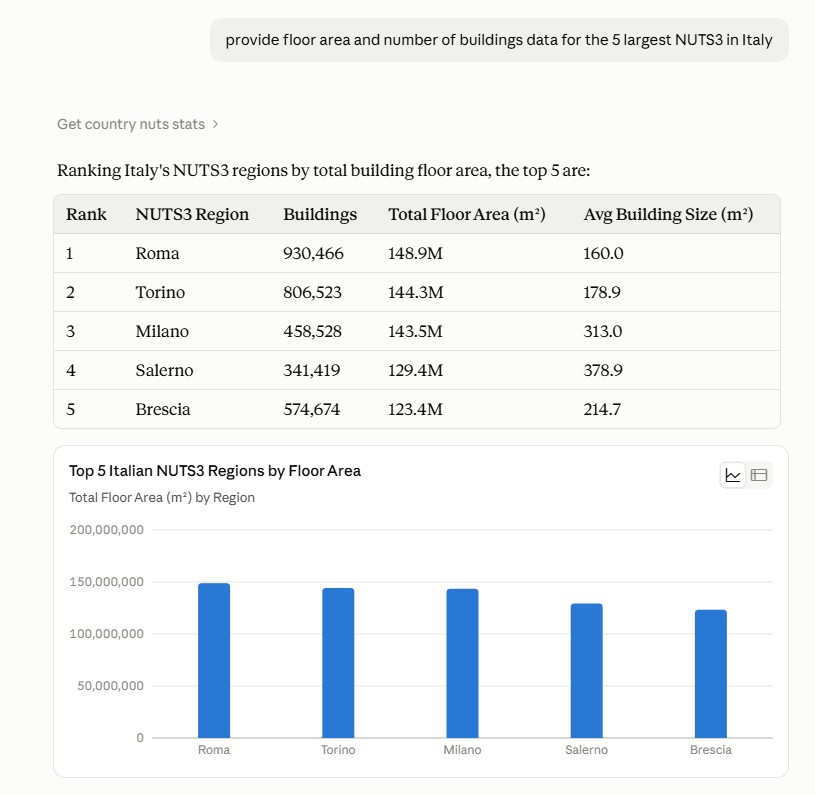
Claude Sonnet rendering NUTS3 region building floor area ranking table and bar chart for Italy using DBSM API MCP

3. NUTS3 Regional Ranking & Charting

User Query: "provide floor area and number of buildings data for the 5 largest NUTS3 in Italy"
Claude invokes the get_country_nuts_stats MCP tool to extract exact spatial statistics from the DBSM API. It constructs a structured ranking table (Roma, Torino, Milano, Salerno, Brescia) highlighting building counts, total floor area, and average building size (e.g. Milano averaging 313.0 m² vs. Roma's 160.0 m²), automatically paired with an interactive bar chart.


Key Benefits of the MCP Approach

  • Traceable spatial statistics: Metrics are retrieved through database queries. Query selection and AI-generated interpretations still require validation.
  • Democratization of Data: Policy researchers can interact directly with complex geospatial infrastructures without SQL barriers.
  • Real-Time Spatial Reasoning: Combines qualitative AI reasoning with quantitative spatial metrics.
  • Protocol Standard: Built on Model Context Protocol (MCP), ensuring seamless compatibility across different AI agents and platforms.

Looking Ahead

Integrating Model Context Protocol with spatial data infrastructures represents a paradigm shift in urban analytics. Beyond static dashboards and specialized GIS workstations, decision-makers can engage in dynamic dialogues with nationwide digital twins—evaluating climate risks, retrofitting needs, and renewable energy transitions in real time.